We use data from by Media Bias Fact Check (MBFC) to calculate political bias and factual reporting scores for the sources. MBFC is an independent website that rates the political bias and factual reporting of media websites. Their methodology is described on their website here. The site has a rating of 100 out of 100 from NewsGuard, another tool that rates website credibility.
MBFC provided us with a comma-separated values (CSV) file consisting of 3,761 rows and five columns. Twenty-five rows were removed because they were either duplicates or contained a source that was no longer on the MBFC website, leaving a total of 3,736 rows.
Each row represents a media website and contains five columns:
We used only the URL and Factual Reporting fields. The Bias field was not used for two reasons: first, 1,599 sources had a Bias value of either Pro-Science, Conspiracy-Pseudoscience, or Questionable, which are not points on the political spectrum. Second, we obtained higher resolution values for political bias by scraping the MBFC website.
We scraped the MBFC website using the Unix command-line tool wget. We wrote Python scripts to process the CSV file and HTML, and used Beautiful Soup to parse the HTML and extract images and text.
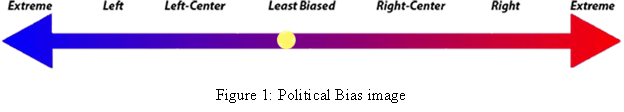
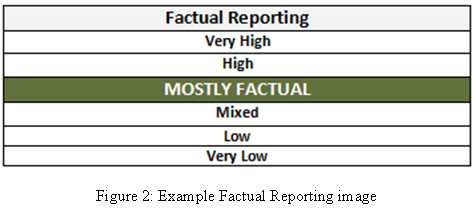
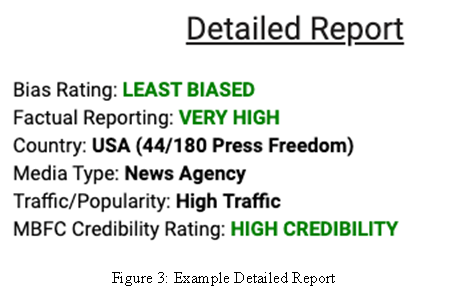
The most useful elements were the images present on most pages (Figures 1 and 2), which allowed us to determine political bias scores for most sites. Images for the factual reporting score were available (Figure 3), but we did not use them because that information was already available in the CSV file.
We were able to extract URLs automatically for most media websites. The URLs for 34 websites were extracted manually because our automated extraction process failed. For pages that didn’t have an image representing political bias, we extracted the political bias from the Detailed Report section (Figure 4) if available.
We determined the political bias score by one of four methods, listed here in descending order of rigor. In other words, we attempted to use the most rigorous method first whenever possible, moving on to the second if not, and so on. If a political bias image (Figure 1) was available, we used that. There were 67 distinct images, ranging from extreme left to extreme right. Therefore, our political bias scale ran from -33 (extreme left) to +33 (extreme right) with zero representing a lack of left/right bias as determined by MBFC. We assigned 3,129 (91.9% of the total) political bias scores using this method, including NPR, PragerU, and The Washington Post.
If a political bias image was not available, we attempted to extract text from the Detailed Report section (Figure 4). There were six distinct values: LEFT, LEFT-CENTER, LEAST-BIASED, RIGHT, FAR RIGHT, and EXTREME RIGHT. To assign numeric values, we used the average score of websites with both a political bias image and a political bias entry in the Detailed Report section. For example, there were 68 sources with both a political bias image and LEFT in their Detailed Report section. For sources with LEFT in their Detailed Report section but no political bias image, we used the average bias score of those 68 sources. This resulted in scores of -22 for LEFT, -10 for LEFT-CENTER, 0 for LEAST-BIASED, 24 for RIGHT, 27 for FAR-RIGHT, and 31 for EXTREME-RIGHT. We assigned 25 scores (0.7% of the total) using this method. Examples of sites scored using this method include Infowars, National Geographic, and the American Lung Association.
We assigned a political bias score of zero to pro-science websites that had neither a political bias image nor a political bias entry in the Detailed Report section. MBFC’s editorial position is that pro-science websites are not biased to the left or right. The Detailed Report section for six pro-science websites had a political bias that we used. We assigned 148 (4.3% of the total) political bias scores of zero using this method. Examples include the Mayo Clinic, NASA, and Smithsonian Magazine.
For sites that lacked all of the above political bias indicators, we used data from Robertson et al. (2018), which are available on Github. They analyzed domains shared on Twitter by accounts known to be associated with the Democratic or Republican parties. They assigned scores from -1 (only shared by Democrats) to +1 (only shared by Republicans). We multiplied that score by 33 to obtain a score from -33 to +33. We compared scores calculated using this method with sites with a political bias image and found that they were strongly correlated (r = 0.841; p < 0.001; n = 1,546). We assigned 109 (3.2% of the total) political bias scores using this method. Examples include Coast to Coast AM, Livestrong, and Greenpeace.
Using these four methods, we were able to assign a political bias score to a total of 3,406 out of 3,736 websites. We rejected the 330 (8.8%) websites for which we were unable to determine political biases by one of the four methods described above. Examples of sites removed included Homeopathy Journal, Illuminati News, and Prophecy Today.
We used the factual reporting score from the CSV file, with the following numeric scores:
See MBFC’s methodology page for descriptions of these six ratings.